


Contents
The most important Google Ads metrics to actually understand performance

May 02, 2024
By Tanya Dharmapala
You only pay on Google Ads when someone clicks. Sounds like a good deal, right? You're absolutely right!
BUT if you're spending all of your budget on clicks that get you nowhere, your ads aren't working. And figuring that out isn't easy. There's a lot of noise on the platform, and a massive table of stats that's just painful to look at sometimes.
If you're drowning in CPCs, CPMs and CTRs, it gets really hard to measure whether your campaigns are performing. Which metrics really matter? Which aren't worth your time? Focus on the wrong metrics, and you'll make some pretty poor business decisions. Nobody wants that.
That’s what we’re going to help you get your head around today. Let's dive in!
What are Google Ads metrics?
Most of us know how popular and powerful Google is. I mean, just considering that every second there are about 2.3 million searches is a mind-blower.
Part of that incredible power is the sheer amount of data Google Ads provides, also known as marketing metrics. These are the statistics around your campaign performance, offered right down to the granular level of each and every keyword. The right metrics should be used as indicators of performance to help optimise your campaigns.
Why only look at the most important Google Ads metrics? Isn't more data better?
Unfortunately, there are a lot of vanity metrics on Google Ads campaigns that can often lead you down the wrong path.
For example, impressions is a metric that tells you how many times your ad has been seen. i.e. if there are 100,000 impressions for your "dentist in perth" campaign, the ads in that campaign have been seen 100,000 times. And you might think the point of a search campaign is to be seen.
How do you get seen more often? One easy way is spending more money.
Here's the thing, and why this vanity metric is dangerous—you don't need to be seen all the time. It all depends on your current performance and goals, and spending more just to be seen means you could be aggressively spending on moments where you won't convert. You'll end up spending more on a click, and by extension, a conversion.
Do you want to have more impressions? Of course - no impressions at all means no clicks. But it's not a key indicator of current performance.
Okay, so what are the most important Google Ads metrics?
Let's dig into the metrics that matter, and more importantly, how they relate to each other. It's important to view some of these numbers together because it's their relationship that actually paints an accurate picture of performance.
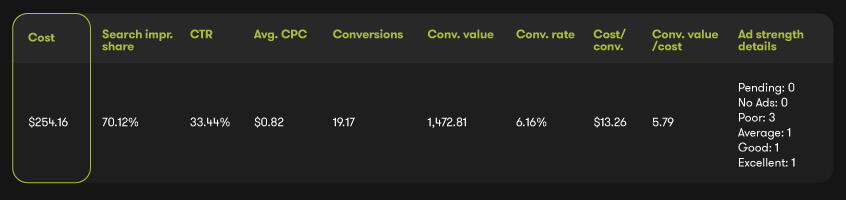
1. Cost
This is an easy-to-forget stat. But an important one to keep an eye on - this is the total spend of each of your campaigns. Basically, how much of your actual budget you've used.
How to use this number:
With the way that Google's daily budget spend can fluctuate, it's essential to keep an eye on this number if you're working with tight budgets.
You can adjust the pacing of your spending by:
- controlling the daily budgets of your campaigns
- changing your bidding strategy to be less or more aggressive
- setting automated rules to pause your campaigns when you hit a certain cost cap
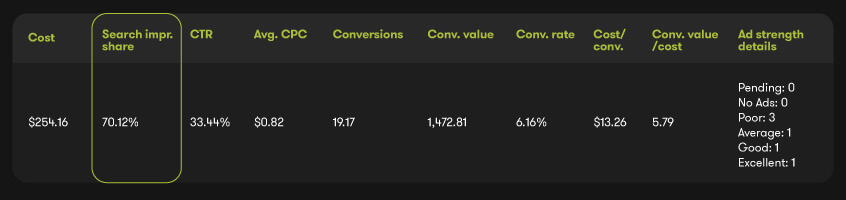
2. Search Impression Share (IS)
Search impression share (IS) tells you how often your ads are seen on Google Search.
If you have a 30% impression share, that means your ads show up 30% of the time. If there were 1000 opportunities to be seen, your ads were seen 300 times.
You can think of it as how much market share you own of the search results.
How to use this number:
If your ad isn’t showing, it could be due to rank or budget issues. Perhaps Google is prioritising other ads that it thinks searchers will be more interested in than yours. Alternatively, your budget might be more limited than other ads, meaning they show up instead of yours.
If your search impression share is low, look at it alongside your "search lost" stats to see if rank or budget issues are having a bigger impact.
- If it's rank, consider the ways you can outrank the competition. Better ads, more relevant keywords, a more optimised landing pages are just some of the ways to improve your ranking.
- If it's budget, you could spend more, unless you're limited by resources.

Be careful with this stat however as it can easily become a vanity metric. Don't spend to be seen more often unless your ad performance is already really strong, and you have capacity to grow. If you try and claim impression share with aggressive spending, you may end up spending more on opportunities that don't convert.
A healthy place to be is around a 70%-80% search impression share.
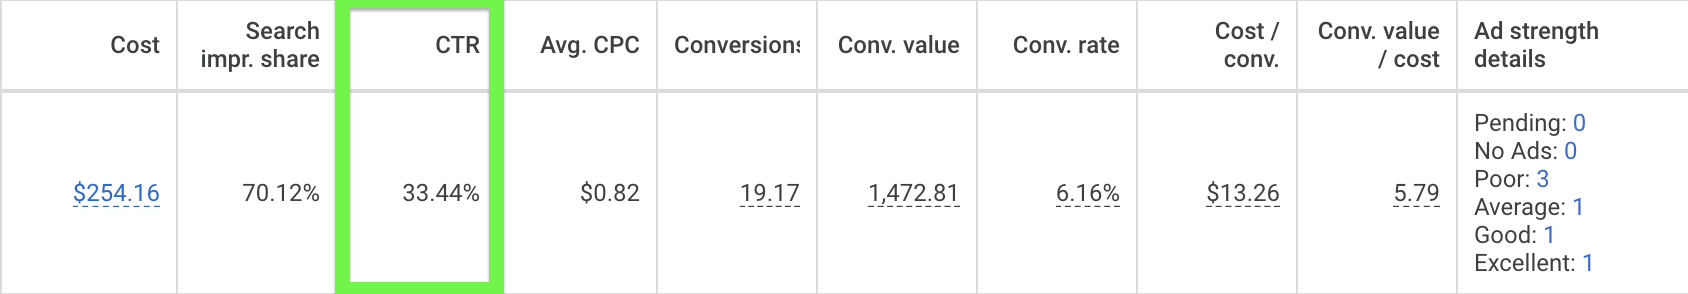
3. Click-through Rate (CTR)
Here's why we said being seen can be a misleading factor—it doesn't tell you how much people engage with your ads. That's where the click-through rate (CTR) comes in. Your CTR tells you often your ads are clicked, out of all the times the ad is seen.
So if an ad is seen 1000 times, with a CTR of 10%, it's been clicked 100 times.
How to use this number:
Ideally, you want a higher CTR, because that means more people are getting hooked in by your ads and going through to your website.
To get a higher click-through rate, you can:
- Improve the quality of your ads, make them more engaging or more relevant to your target keywords
- A/B test different ad variations or try pinning your headlines in a responsive search ad
- Consider spending more to get your ad showing in a higher position (the first result usually gets more clicks)
- Refine the keywords you are targeting, and make sure you're actually answering the questions people have when they search
Be careful with this stat as merely driving more clicks isn't enough if they're not the right quality (targeting the wrong terms and driving people who aren't in the right stage of your customer journey to your landing page).
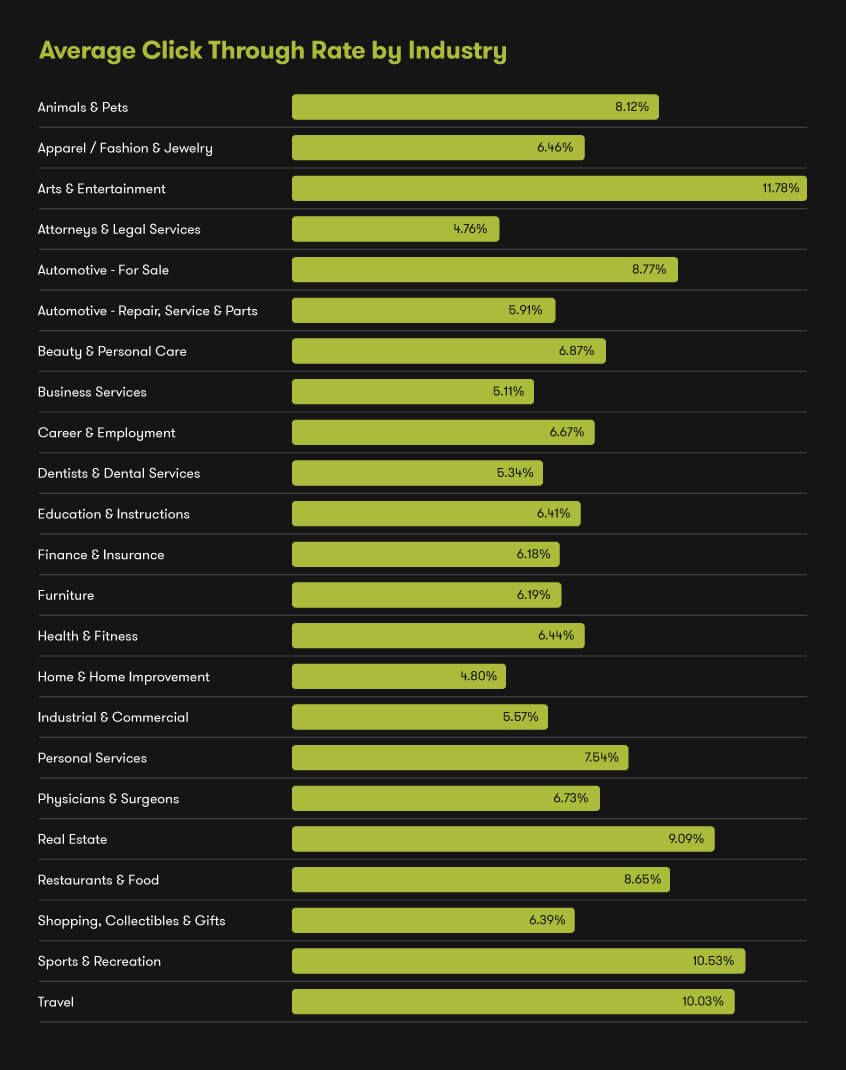
The average CTR for all industries is 6.11% according to WordStream, the go-to for Google Ads benchmarks each year. But your industry average is the most useful.
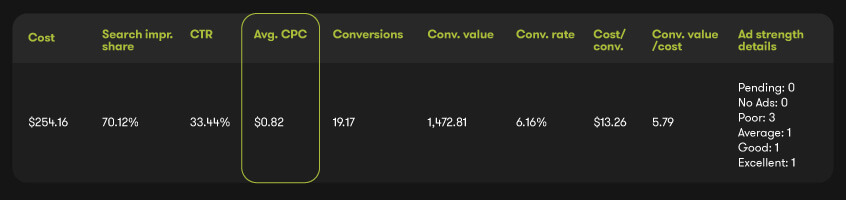
4. Cost Per Click (CPC)
How much are you paying for each click you get? That’s your cost per click.
A click doesn’t necessarily result in a conversion, so it’s important to focus on the quality of the traffic your ads are bringing in. In other words, your ads should target clicks that are both inexpensive and valuable.
How to use this number:
Similar to CTR, the average CPC is decided by several things: the competitiveness of the industry; the quality of your ads; your bidding strategy, etc.
CPC is a good way to troubleshoot the cost of your ads - if you're spending a fair bit on conversions, it's worth looking at how high your CPC is and working backwards from there:
- which keywords have the highest CPC—are they relevant?
- what's the expected CPC based on your original keyword research?
- based on your current conversion rate, how much could you afford to pay for a click to make the ads viable?
Wordstream has some great industry benchmarks that will help you determine if your CPC is within a normal range.
Once you understand where your CPC should be, you can set cost caps to control that spend. Keep in mind that it will also limit the frequency your ads are seen, as you may not be able to bid high enough on certain searches.
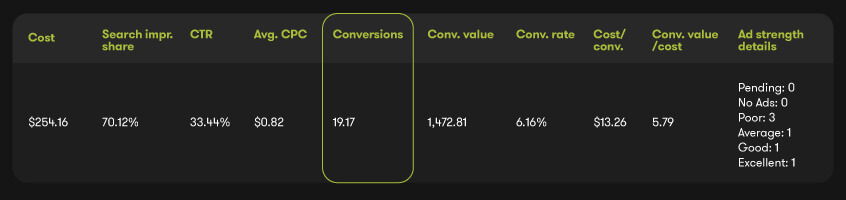
5. Conversions
Now we get to the fun stuff, the result of your ads. These are your conversions—the actions you've determined are the most valuable for your business. Your conversions are usually contact actions like calls or emails, lead generation actions through forms, sales actions like product purchases, or anything else that makes sense for your business.
How to use this number:
To get the most value from your conversions metric, you need to have proper conversion tracking in place and connect your Google Analytics 4 account to your Google Ads account. If you're selling products, make sure your Google Merchant Centre is also connected. If you're trying to drive store visits, make sure your Google Business Profile is also connected. These will give you the full picture of the valuable actions happening for your business.
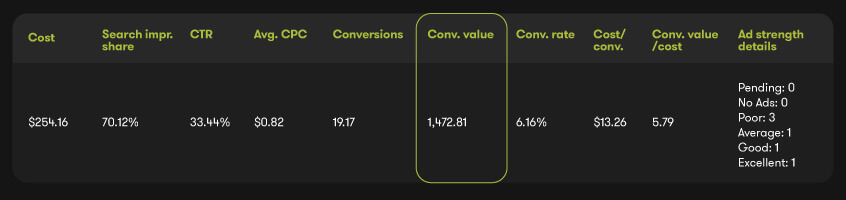
6. Conversion Value
If you're selling products, you may want to look at your total sale value rather than the number of purchases to get a better view of results. For example, if you sell high-value products that people buy less often, looking at the number of conversions may make it seem like your ads aren't performing. But looking at your conversion value tells you that despite having fewer conversions, the value of your conversions is strong.
How to use this number:
For product campaigns, the conversion value is good for determining the average sale or cart value. If people buy more frequently but spend less, how can you get them to spend more in one sale—bundles, free shipping tier, limited-time or edition products, etc.
For lead generation or local action goals, you can help Google Ads optimise for certain conversions by assigning them a value and setting your bidding strategy to maximise conversion value.
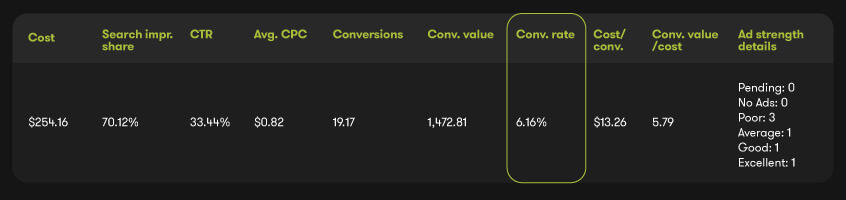
7. Conversion Rate
The number of conversions or value is only a small piece of the puzzle. You also need to know the rate at which it's happening—the average conversion rate—to know if your ads are effective. If you’re converting a high proportion of people who click on your ad, then that’s great! If your conversion rate is pretty low it’s probably an indication that your landing page, keywords or ad copy needs some work. A low conversion rate can also indicate that you’re targeting the wrong audience or search terms.
How to use this number:
Understand where your conversions should be. What is the minimum rate to make your ads viable, given your current sales rates and profit margins? What is the average for your industry?
Wordstream offers a really good break down on conversion rate by industry:
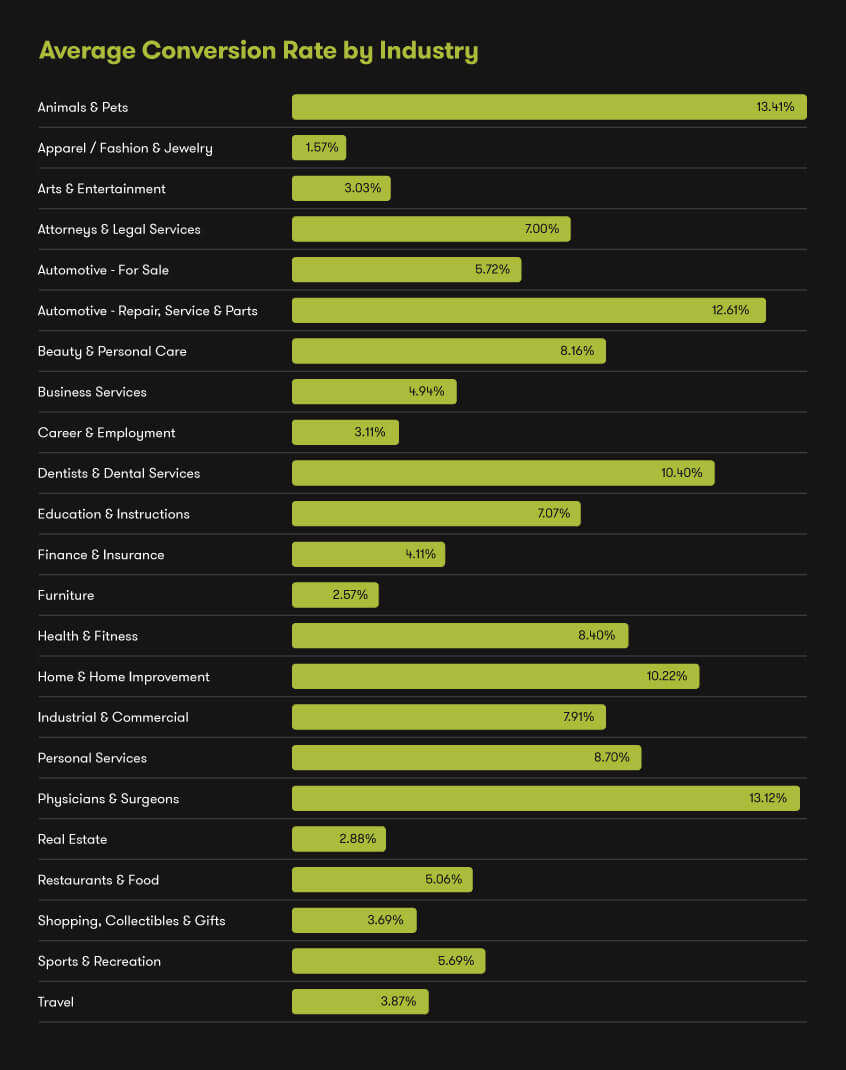
Once you have a decent goal, you can use the metric as a way to troubleshoot if you're sitting under the benchmark—look at your conversion rate at the campaign, ad group, ad and keyword levels. You can also use it to monitor how specific locations, audiences, and times of day perform to hone in on the best opportunities to convert.
Keep in mind it also depends on what you define as a conversion. Lower-value actions (signing up to an email list, clicking on a phone number, etc) convert better so they can artificially inflate your conversion rate.
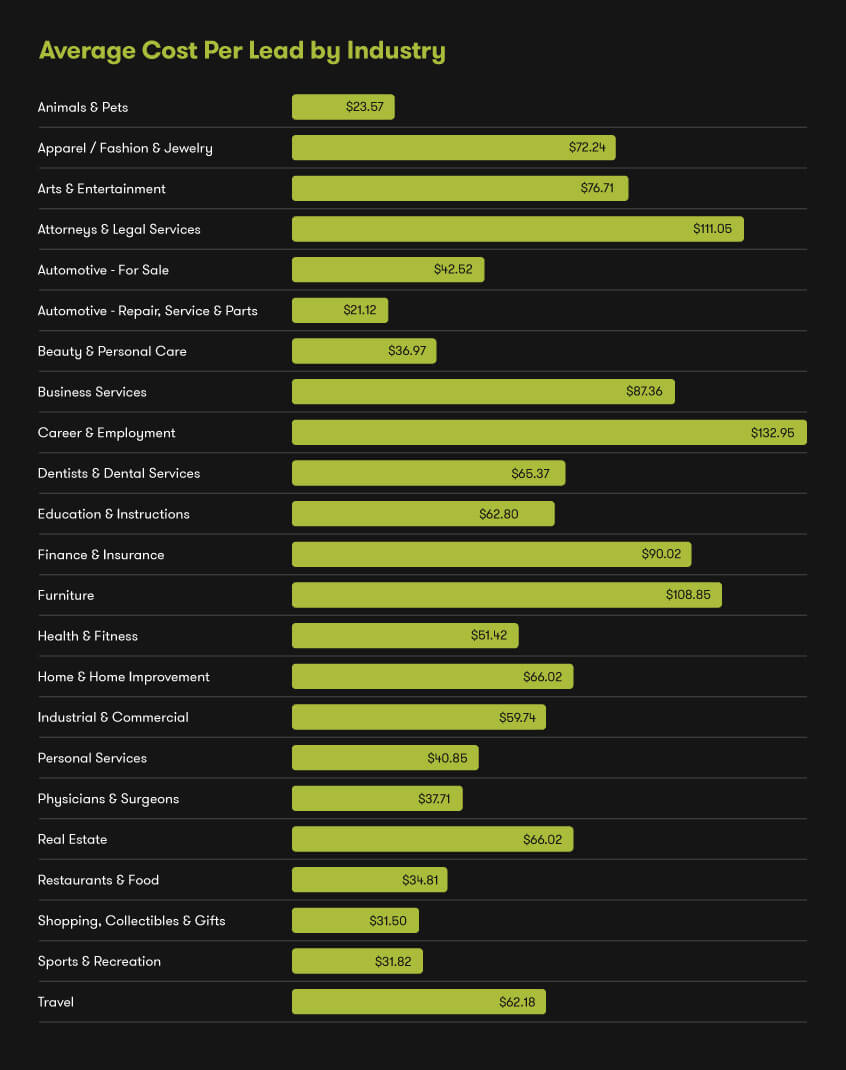
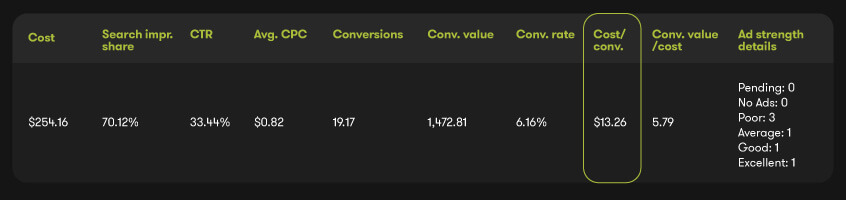
8. Cost per Conversion
You may be getting a lot of conversions at a high rate, but if you're spending way too much on each conversion, your ads are still not viable. The cost of getting a defined result your cost per conversion—also known in the marketing world by many others names such as cost per acquisition, cost per lead, cost per sale, etc.
How to use this number:
Every campaign has different goals, so it’s pretty hard to give a standard benchmark for cost per conversion. Wordstream once again has some pretty good benchmarks to refer to.
However, you have to figure out the best cost per conversion for your business based on typical conversion rates, profit margins, cost per sale of goods and so on.
Let’s consider two imaginary companies. Company A runs an ad campaign to get email sign ups. Let’s say they spend $50 for each sign-up. Company B runs an ad in which they want people to buy a $500 product. Let’s say they spend about $250 for each conversion.
Company A has a lower cost per conversion, but company B is actually seeing a $250 return on investment. So they’re not really comparable. Think about all the factors that make your ads profitable including final sale rates to determine the ideal cost per conversion.
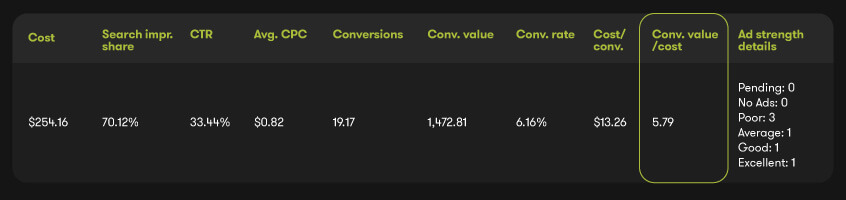
9. Return on Ad Spend (ROAS)
Return on ad spend (ROAS) tells you that for every dollar you spent on Google Ads, how much money you've made. This metric is actually called Conv. value/cost on Google Ads now.
Basically, you take the total amount of conversion value and divide it by amount spent. For example if you sold $1000 worth of product from $100 of ad spend, you would calculate the ROAS as:
$1000 / $100 = 10X ROAS
How to use this number:
The ROAS brings everything you have been measuring above into one cohesive metric that answers a key question—what are your Google Ads worth to your business?
Measuring ROAS is often the starting point of troubleshooting, as you should have a minimum required ROAS to ensure ads are profitable. If your ROAS isn't where it should be, or is fluctuating, you then start working back through all the other metrics mentioned above to figure out where you can optimise.
The other thing ROAS doesn't tell you is the potential customer lifetime value. Going back to company B, they may spend $500 this time, but what if they come back to buy it again? And again? Now they've made $1500 from one person. From a sale cost of $250. That's 6x ROAS instead of 2x.
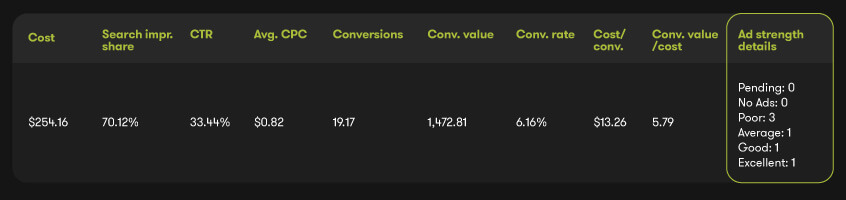
10. Quality Score
Last but not least, your ads quality score, also known as ad strength details in the Campaign view. Quality Score is essentially how Google rates the relevancy and quality of your keywords. This score is calculated on a number of factors: ad relevance, CTR and landing page experience. It then gives you a grade of poor, average, good or excellent ad quality.
How to use this number:
If you have ads that are average or poor, where the campaign is not performing, it's time to look to your quality score and see how you can improve the ads—thus driving up clicks, lowering CPC, getting better conversions, lowering your cost per conversion and improving ROAS.
- What is your ad copy like? Is it engaging? Does it have strong USPs? Does it stand out from competitor ads?
- What are your landing pages like? Do they convert well? Do they provide a good user experience? Can people get the information they need to want to convert?
- What keywords are you targeting? Do you understand the intent of those keywords? Is the content of your ads and landing page answering the questions people have when they search?
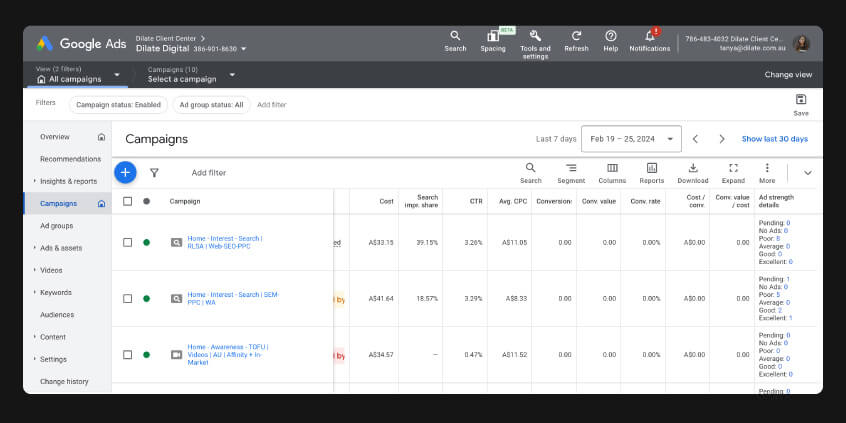
How to set up your Google Ads overview to show you the right metrics
So, how do you cut through the noise and get to the real numbers? Let's walk through it.
Jump into your campaign overview tab on the right.
Hit the Columns option and click on "Modify Columns".
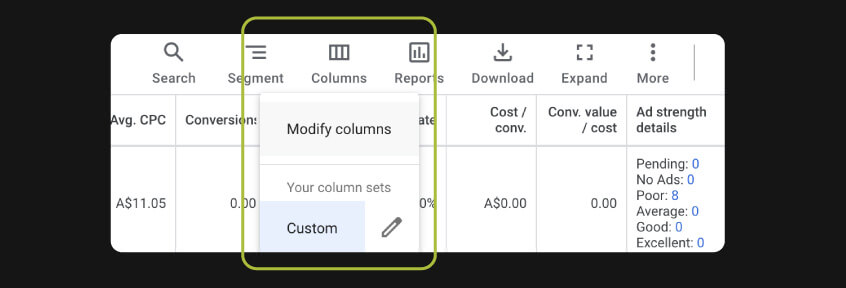
This will give you all of the metric options to consider. It's worth going through all of them to see if there are other metrics useful to your business or goals.
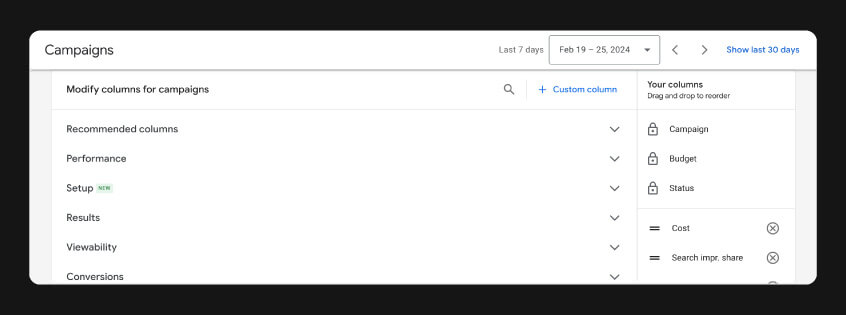
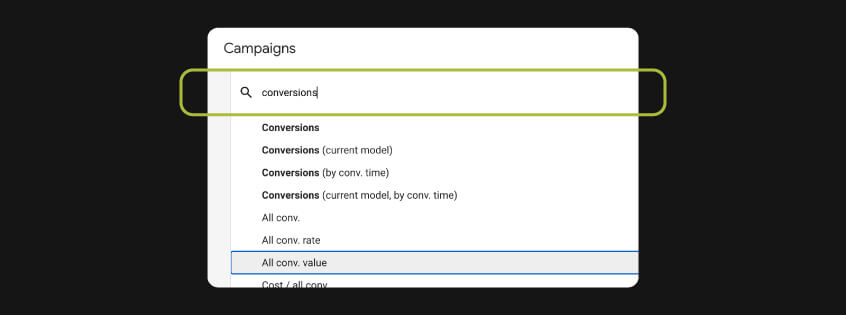
You can search for the metrics you want in your dashboard.
On the right, you can see all the columns that will show up in your dashboard, and you can click and drag on the little = sign to move them into the order you want.

How to work with Google Ads metrics effectively
Each metric has its own use but it's still easy to get lost in the ocean of data. In order to get the most out of your campaigns, you need to:
- Set clear goals for your marketing strategy to measure against, ideally for each core metric. This gives you a benchmark of whether things are performing in your marketing campaigns. Use industry research, WordStream averages, past performance analysis and more to get the info you need. Your campaign objective should be set to optimise for these goals.
- Visualise your performance with dashboards. Sometimes looking at a series of numbers doesn't give you the full picture—use charts and detailed tables to give you granular breakdowns, see trends over time and measure the relationship of metrics together.
- Follow trends—keyword trends that is. Keep a super close eye on how the market fluctuates as that often dictates cost per click and conversion rates. Don't forget to keep an eye on new keywords or rising competitor brand names you may want to add as negative keywords on the campaigns.
- Know your industry benchmarks. We've shared quite a few here on the blog from WordStream which is a go-to source of some great benchmarks, updated yearly. But also understand how market position and brand authority can influence that.
Ready to dig into the numbers?
Hopefully, you're excited to throw yourself into a world of stats and figures, knowing how powerful these metrics can be. Used correctly, you can drive some serious ROI for the business.
But if you're sitting there thinking this is a lot to have to measure just to keep your ads running smoothly, no worries. That's what we're here for. Our Google Ads experts are obsessed with numbers and the nitty gritty optimisation Google Ads campaigns can demand sometimes—they love it so you don't have to.
Get in touch for a free Google Ads audit and see how we can help you!


